hello@alexhawthorne.com

Dashboard Design: Colorado Wage
and Outcomes Results Coalition (WORC)
For the Colorado Evaluation & Action Lab, a partnership between
the University of Denver and the State of Colorado. 2025.
UX/UI designer, with economists, an executive director, and software engineers.
The team’s mission was to track and share workforce data with a coalition of public and private workforce development organizations, in order to foster an accurate understanding of the status and efficacy of Colorado’s workforce development initiatives.
The workforce data was shared via a monthly newsletter. There was no version of the data that enabled people to personalize what they viewed, whether they wanted to analyze custom sets of information, time periods, or other information.
The team’s solution was to create a digital dashboard to contain this data, and to include built-in tools for tracking and comparing data points from different categories or time periods. I was hired to ensure that the user experience of this dashboard would be optimal for each type of target user. Note that our target users were not paying customers, but rather members of an economic coalition. Our KPI was not strictly revenue-related, but rather would be the success of our members' workforce development programs over time.
I needed to first understand the data that our users were being provided. I met with the economists responsible for said data, and they explained how to interpret it, what insights each type of user was looking for, and gave me some ideas for the optimal visual design of each infographic.
Our target users:
Because WORC knows who all of its individual users are, we had access to a lot of information about each of their needs. We put together personas that included each group's goals, key interests, and questions they needed to answer:
“Providers,” who provide skills training and career support with the goal of improving participant employability, job stability, and wages over time.
“Funders,” who provide grants to training providers, often with a focus on measurable outcomes and return on investment. They need to demonstrate impact to their own boards and donors.
Designing the dashboard:
Working with the team to ensure technical feasibility and the optimal presentation of the economic data, I then presented pre-launch, post-launch, and potential (dependent on future funding) design guidelines. Together, we turned their live data into an interactive dashboard that could be used by non-technically savvy users, while providing the widest feasible amount of customization and depth for all information. Every page includes a toolbar with “Undo,” “Reset,” and “Save Custom View” buttons, for a less frustrating, less time-consuming personalization process.
Earnings Data

We provided context on each workforce program, so that users can compare their own program to other programs (which they most likely know less about).
We split the filters for the data into separate dropdowns, to provide the most possibilities for custom setups.
Industry Data
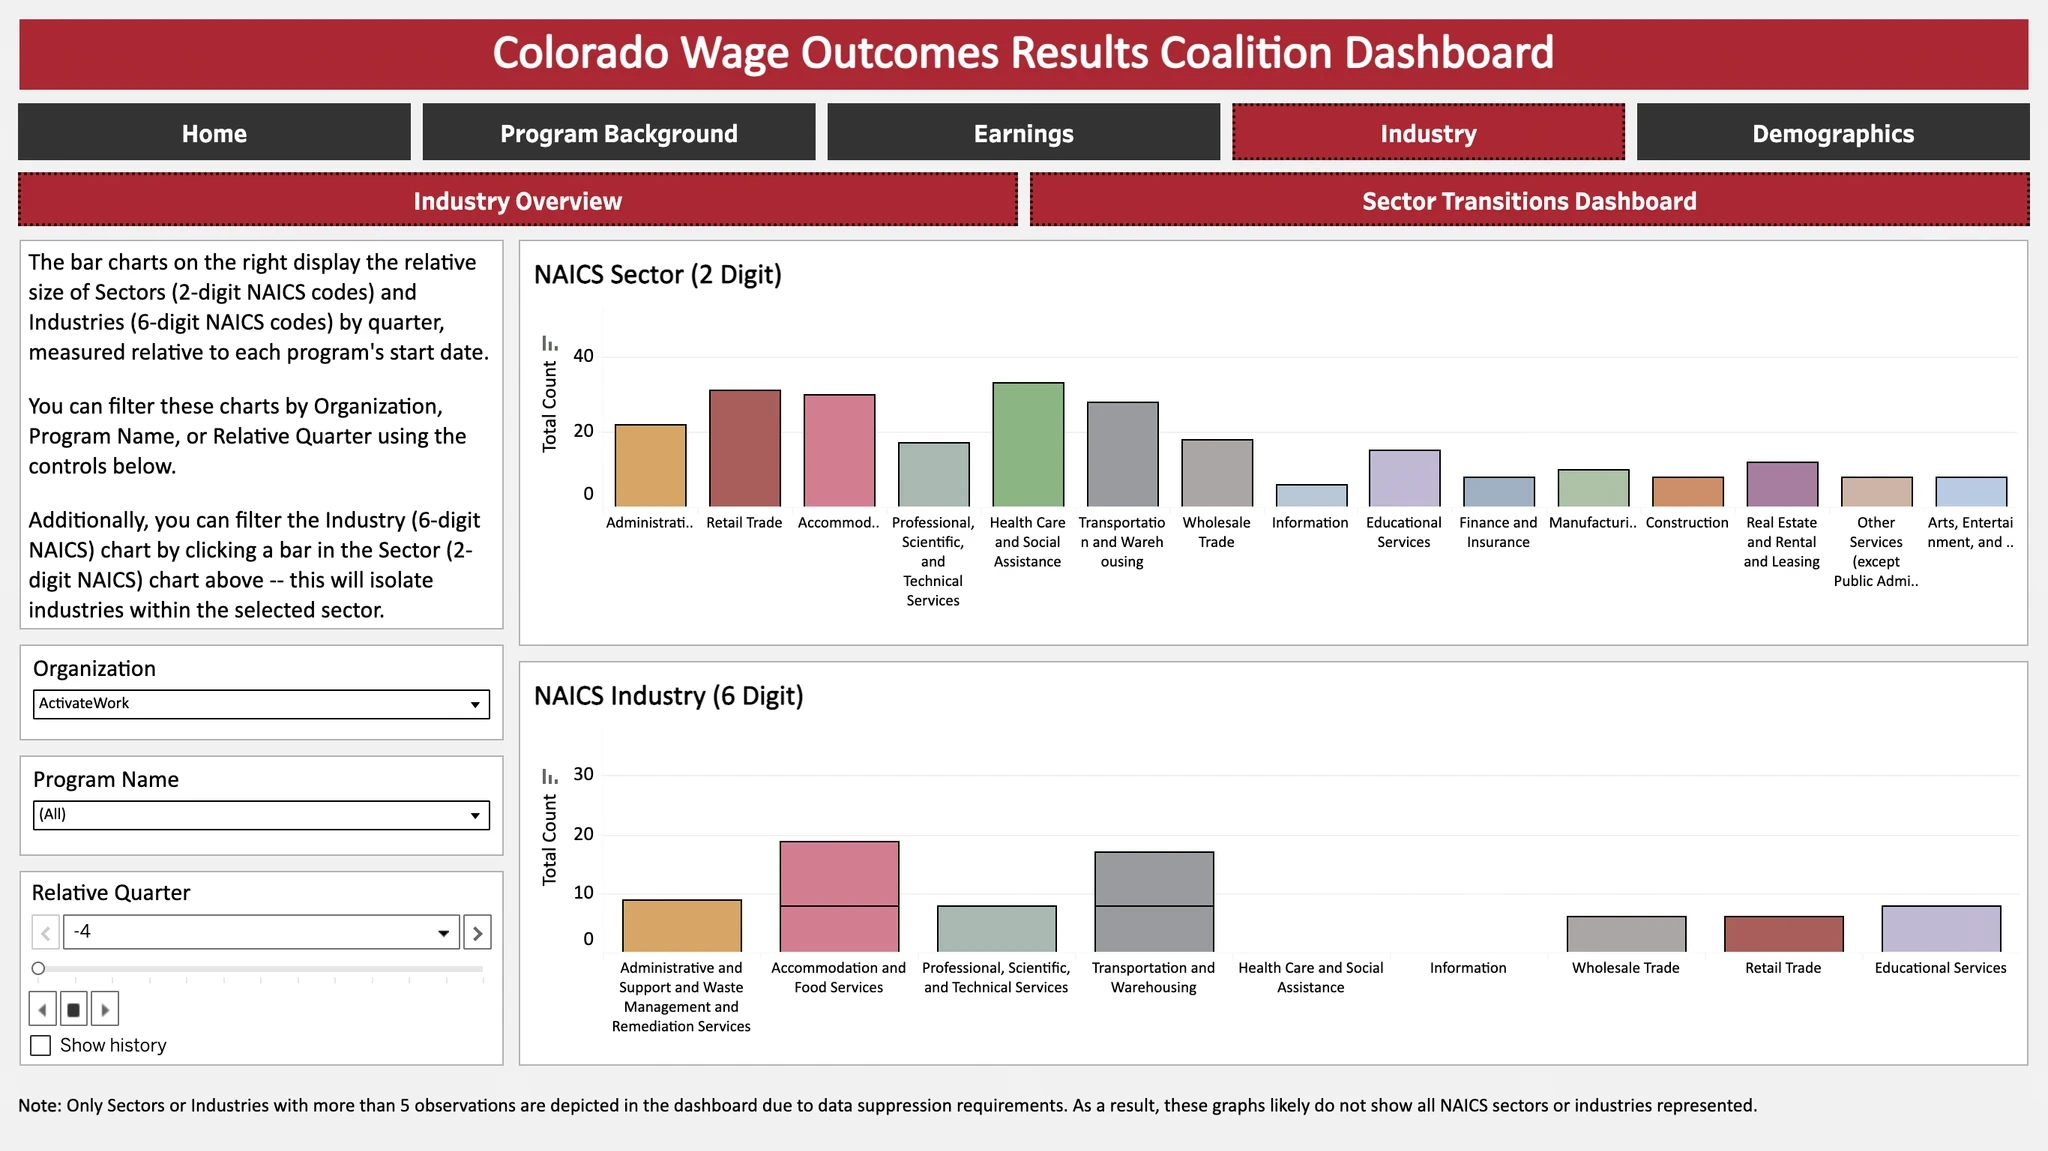

We wrote explicit instructions to help all types of users maximize these tools.
The "Relative Quarter" section on the first page has playback controls for animating changes in data over time (useful for visualization and for users who need to create presentations).
Hovering over information supplies more specific details, allowing a single page to enable thorough review of data.
Demographic Data
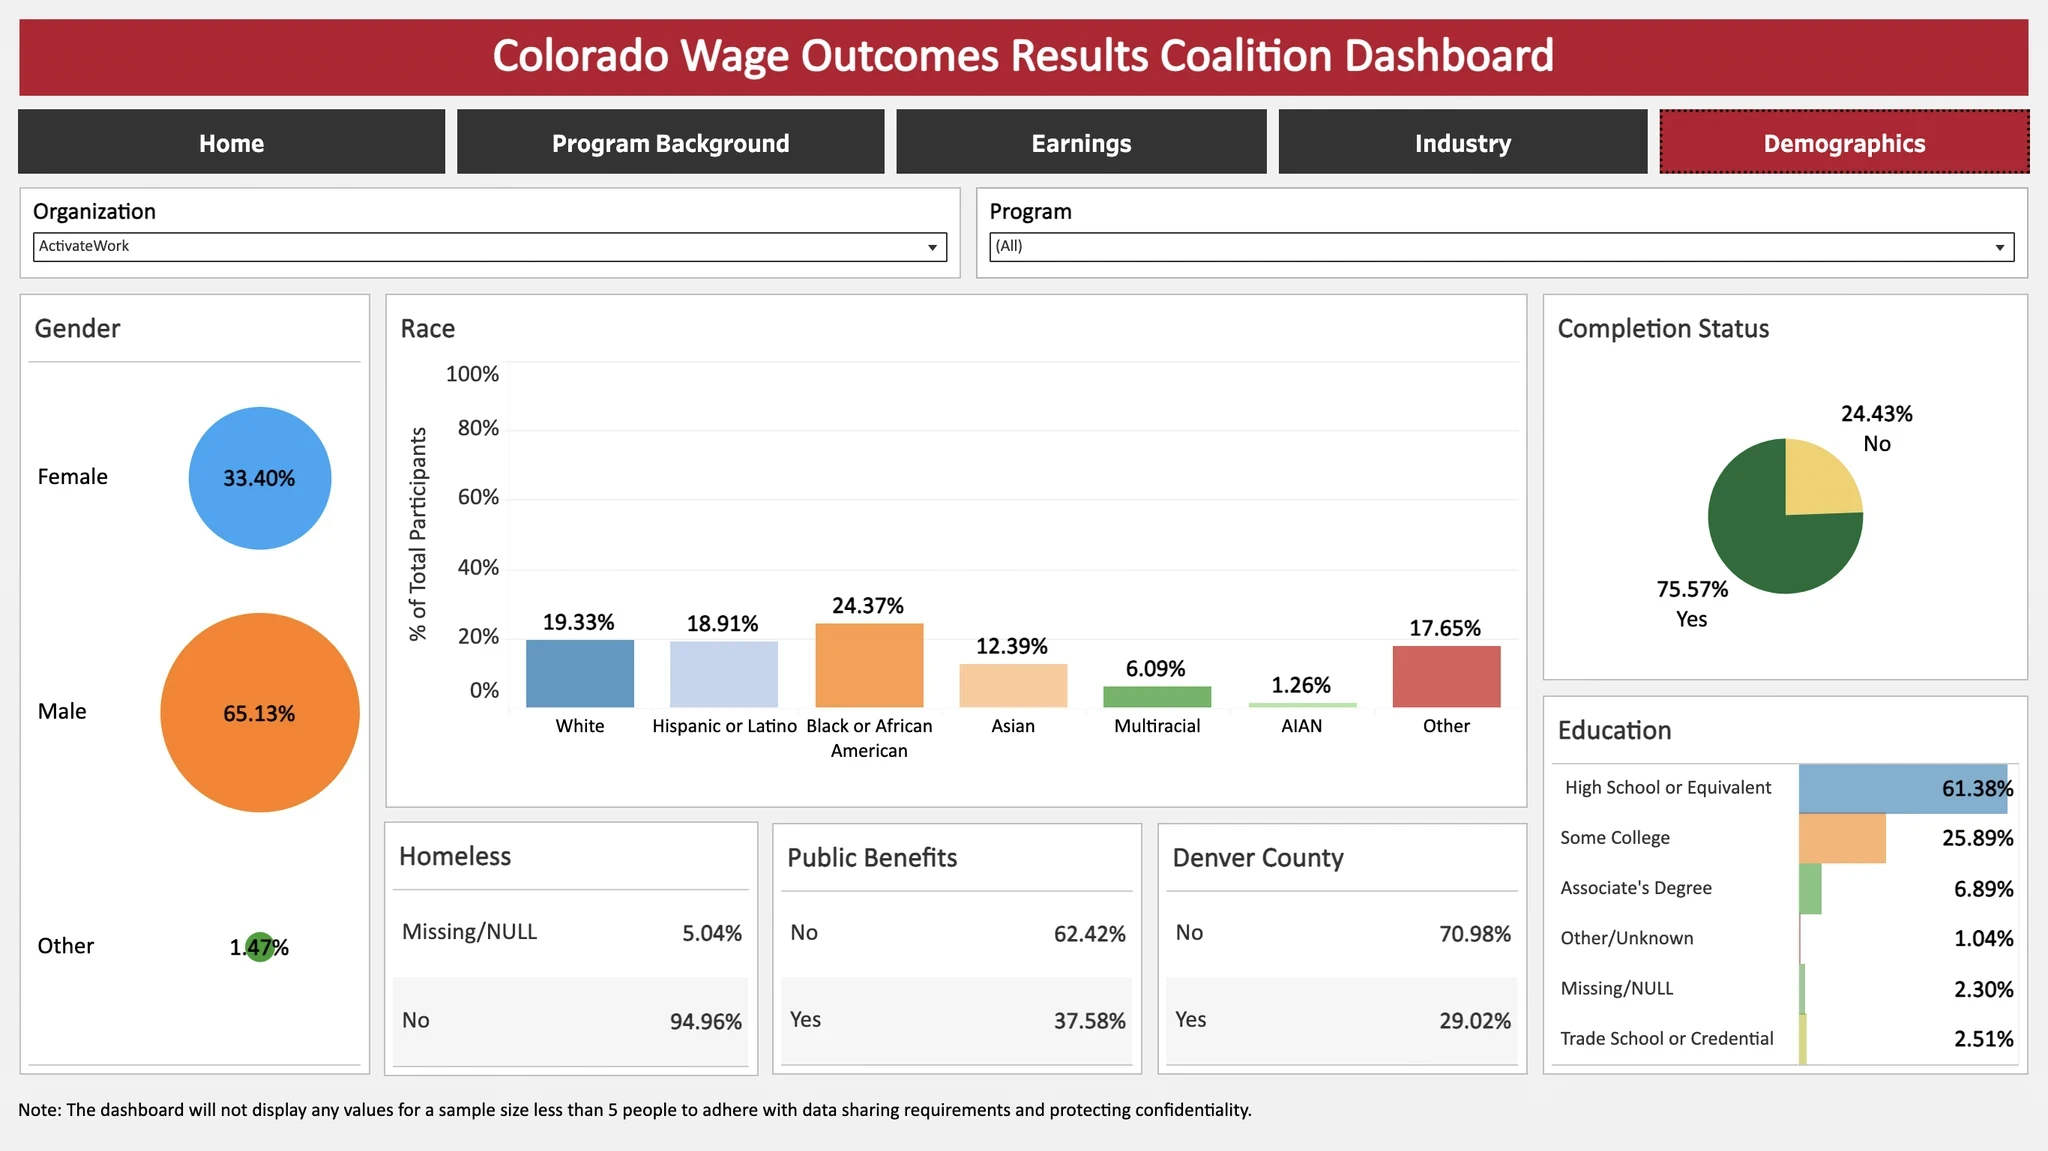
Hover provides exact numbers of participants.
Conclusion and outcomes:
Once the dashboard was ready to launch, I worked with the economists and executive director on our team to prepare a live demonstration, that would introduce the dashboard to users and teach them how to use it. I created the visual presentation and helped edit the copy.
“The Governor called out partnerships with select organizations, including the Colorado Lab, as key to building the capacity and expertise of state leaders in advancing the use of evidence to drive smart state investments.” †
“Results for America, a non-profit organization devoted to helping governments use evidence and data to make better decisions… gave Colorado… its highest designation – as one of the three top states in the nation for building and using evidence and data to drive taxpayer dollars toward proven solutions.” ††
† From the article “Colorado Lab Recognized for Contributions to Evidence Building Excellence”
†† Gov. Jared Polis, “FY 2026-27 Budget Request,”
“Alex is great, super-detailed in his review, and with a nice range of easy-to-implement improvements and longer-term ones.”
– Elysia Versen, acting executive director at the Colorado Evaluation & Action Lab